How to Read a Bitcoin Order Book and Market Depth Chart
Learn what bids, asks, spread and cumulative depth mean, then read them directly in the free cryptonabs BTC/USDT viewer.
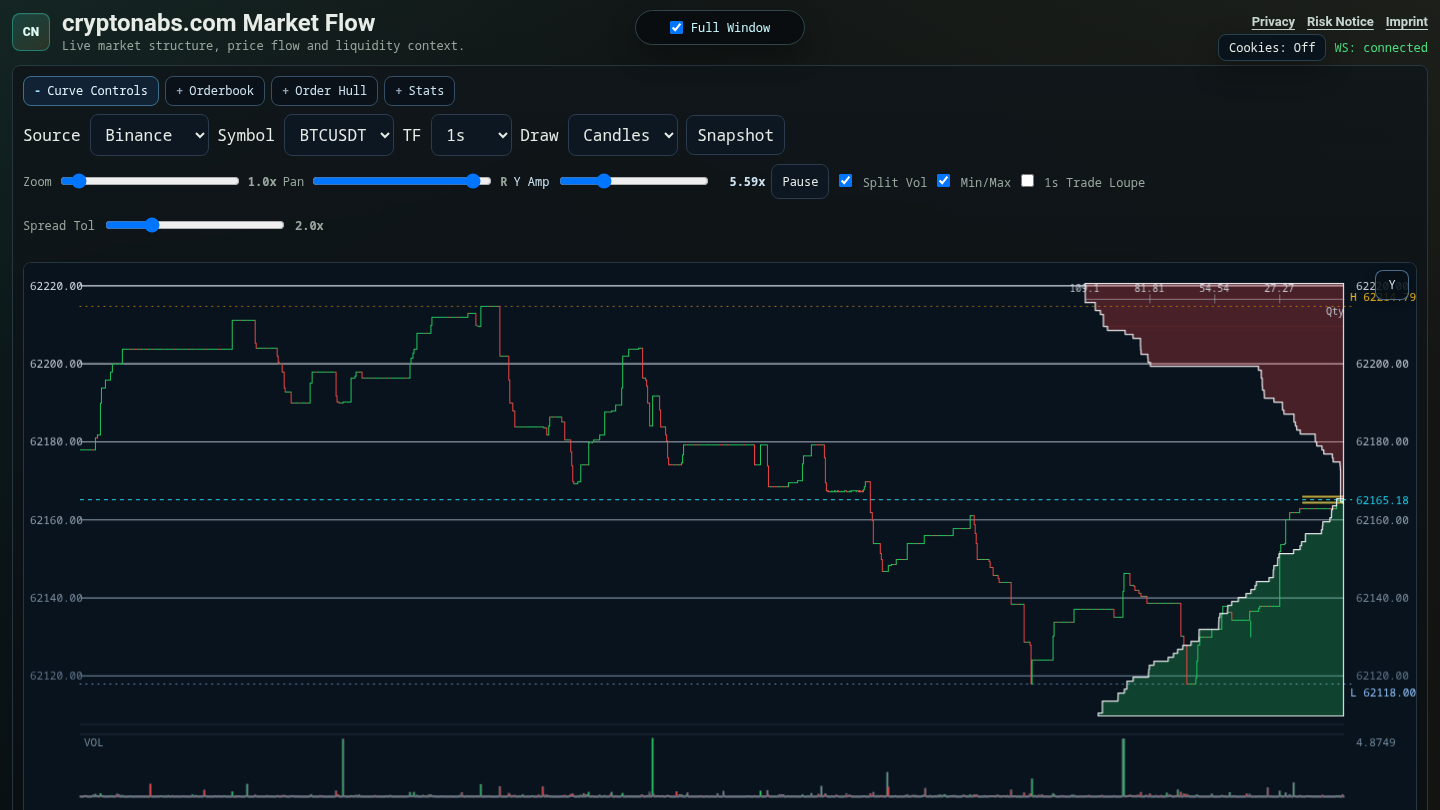
A Bitcoin order book is a live list of resting buy and sell orders for one trading pair on one venue. Bids are buy orders below the market, asks are sell orders above it, and the difference between the best bid and best ask is the bid-ask spread. A market-depth chart turns those price levels and quantities into a shape that is faster to scan than a long table.
You can follow the steps below in the free live Bitcoin order book. The public viewer currently shows BTC/USDT from its named source, needs no exchange account or API key, and cannot place a trade.
1. Check the source, pair and timeframe
Start with the controls above the chart. Source identifies the exchange feed, Pair identifies the exact base and quote assets, and Timeframe controls the candle aggregation. BTC/USDT on one exchange is not the same dataset as BTC/USD or a cross-exchange market.
The candles and order book also represent different time concepts. Candles summarize executed trades over a period. The order book is a rapidly changing snapshot of orders that are currently resting and may be changed or cancelled before execution.
2. Find the best bid, best ask and spread
The highest bid is the nearest visible buyer below the market. The lowest ask is the nearest visible seller above it. Their difference is the spread. A narrow spread describes the current gap between these two quoted prices; it does not guarantee that a larger order can execute at either displayed price.
In the cryptonabs chart, bids and asks meet around the current-price region on the right side. The separate order-book rows expose exact visible price and quantity values. The curve is a visual summary, so use the rows when an exact level matters.
3. Read quantity and cumulative market depth
Each raw order-book level has a price p and a resting quantity q. With Cum Depth enabled, cryptonabs sorts asks outward from the best ask and bids outward from the best bid, then computes the running quantity at each level:
This answers a precise descriptive question: how much displayed resting size lies between the best quote and that price level in the currently received book? Turning Cum Depth off shows the quantity at each individual level instead.
4. Understand the cryptonabs Order Hull
Order Hull is the name of the market-depth overlay drawn beside the candles. Price determines vertical position. Quantity determines how far a band extends left from the right-hand price anchor. In cumulative mode, farther price levels normally include all nearer quantities, so the outline grows as it moves away from the spread.
Several nearby price levels can map into the same few-pixel vertical band. The renderer retains the applicable depth for that band and scales widths against the visible reference depth. It closes visual gaps between real neighboring bands, but it does not extend the outermost bid or ask to a chart boundary where no level was received. That is why the Hull is a stepped depth curve rather than two rectangles filling the plot.
Absolute anchoring places levels on the same price scale as the candles. Relative anchoring concentrates on depth near the current price. Zooming or choosing a long candle timeframe can compress the book into a small part of the much larger historical price range; it does not mean the order book contains only two levels.
5. Treat walls as changeable orders, not predictions
A visibly wide section is often called a buy wall or sell wall. It means the received snapshot contains more resting size around those prices than around thinner sections. Orders can be amended, cancelled or executed, and the view covers only one selected venue. A wall therefore is neither confirmed support or resistance nor a forecast of the next price move.
6. Check freshness before interpreting the chart
The large value above the chart belongs to the selected source, pair and timeframe. Connection status, loading state and continuing chart progress matter as much as the displayed number. A browser can retain old pixels after a disconnect, which is why cryptonabs reconnects and reloads state when a restored tab resumes.
For a fuller reliability checklist, read the limits of live crypto order-book data. The separate guide to restored browser tabs and live charts explains why an HTTP response alone cannot prove that a chart is fresh.
What a depth chart does not tell you
- It does not show every exchange, pair, hidden order or future order.
- Displayed liquidity can disappear before any execution reaches it.
- Width is relative to the current view and is not a cross-market liquidity score.
- The Order Hull is a depth curve, not a historical liquidity heatmap.
- The viewer does not predict direction or provide buy, sell or hold recommendations.
- cryptonabs.com does not route orders, hold assets or manage portfolios.
See the market-data and risk notice for the complete public boundary. This article was prepared with AI assistance and reviewed against the implemented viewer behavior before publication.