Can You Trust a Live Crypto Order Book? Data Limits Explained
A live order book is useful technical context, but it is not a complete record of every venue, every order, every correction or every browser state.
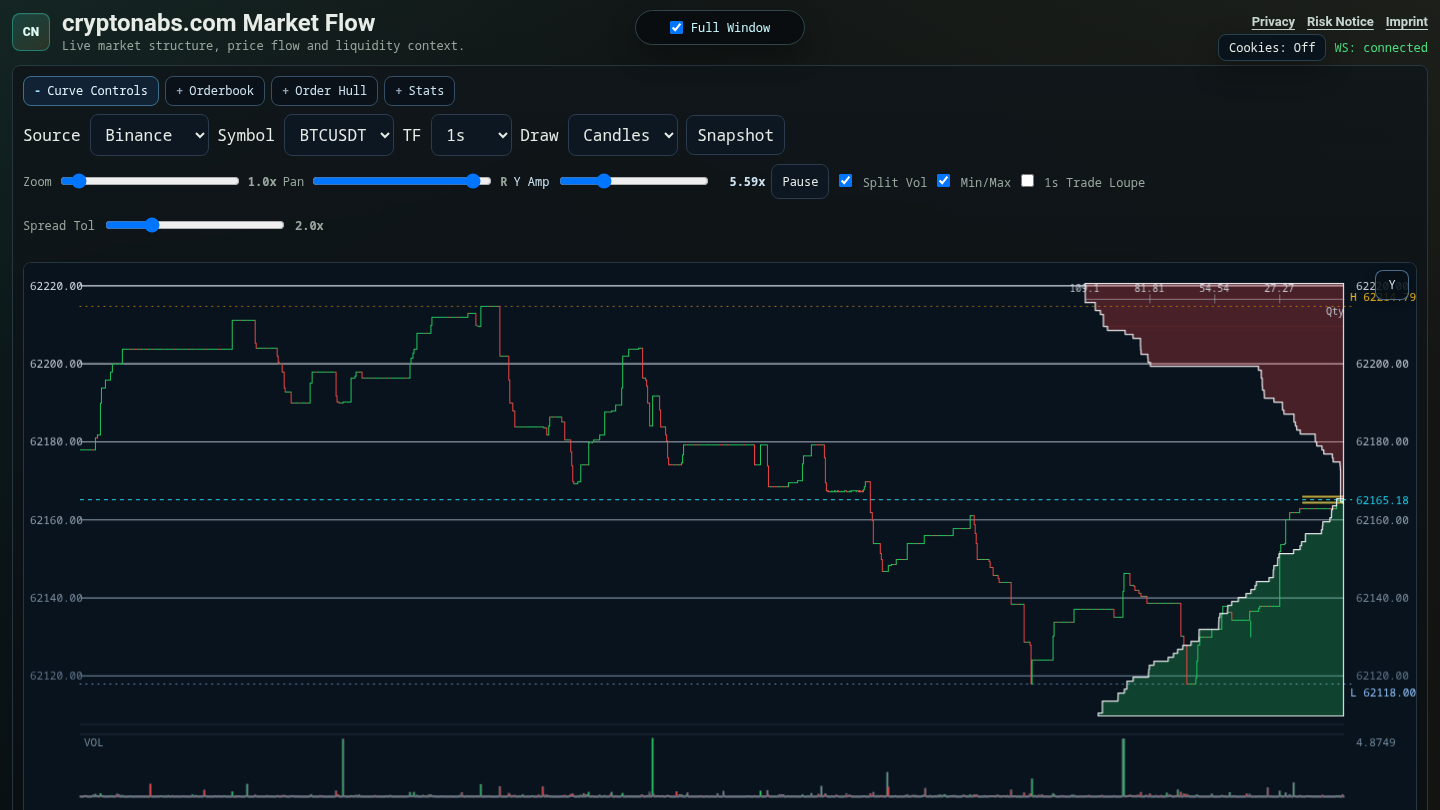
Live crypto dashboards often look direct because numbers move quickly on screen. That can hide a basic engineering fact: the view is only as current and complete as the public market-data source, the network connection, the browser runtime and the dashboard's own recovery logic. The cryptonabs live Bitcoin order book therefore identifies its source, pair and connection state instead of presenting one feed as the whole market.
For a read-only dashboard, the right product promise is observation, not certainty. A chart can help inspect public price flow, orderbook-depth context and recent liquidity conditions. It cannot guarantee that every source is available, that every message arrived, or that a derived metric is suitable for an external decision without independent verification.
Where Public Data Can Drift
Most visible issues are ordinary distributed-system issues. They matter because a chart can still render something while the underlying feed is partial or stale.
- Exchange downtime: a source can pause, degrade, return errors or temporarily stop publishing a channel.
- Rate limits: public endpoints can throttle requests, which can delay backfill or reduce refresh frequency.
- Websocket disconnects: a browser can lose a stream while old values remain visible on the canvas.
- Message gaps: network loss or reconnect windows can leave missing trades, candles or orderbook updates.
- Corrections: a source can revise, replace or restate previously published values.
- Venue scope: one exchange or symbol pair is not the full market.
- Browser lifecycle: restored tabs, sleeping devices and background throttling can leave a view behind real time.
These are not edge cases. They are normal constraints for any browser-based tool that depends on public remote data. A reliable dashboard has to show fresh state, recover from stale state and avoid language that turns an incomplete observation into a recommendation.
Derived Metrics Are Context
Derived values such as candle reconstruction, visible range, volume split, orderbook-depth bands or liquidity context are transformations of source data. They are useful because they make a dense stream easier to inspect. They are still derived outputs, not authoritative instructions.
A conservative implementation treats derived metrics as context with visible limits. If the source feed is delayed, the derived output is delayed. If the stream has gaps, the derived output may have gaps. If the browser is recovering from a restored tab, the derived output should not be treated as fresh until the page has reconnected, redrawn and advanced.
What A Read-Only Dashboard Should Make Clear
The public surface should keep the user's mental model simple:
- the site displays market data and derived visual context
- normal public use does not require an exchange login or API key
- the site does not hold deposits or customer assets
- the site does not route, place or execute orders
- the site does not provide individualized guidance or financial advice
- public data can be delayed, incomplete, stale, corrected or unavailable
This boundary is not only legal wording. It is also technically accurate. A read-only browser view can observe and visualize; it cannot remove uncertainty from external data sources.
How To Test The Boundary
Operational checks should test both availability and freshness. An HTTP 200 proves that a route responded. It does not prove that the chart is alive, current or meaningfully drawn.
- verify that public routes, robots, sitemap and legal pages return expected status codes
- check that websocket state is connected when live mode is expected
- sample canvas pixels to detect a blank or nearly blank chart
- compare rendered and visible candle counts against a minimum threshold
- watch a live counter or canvas hash to confirm progress after load
- simulate browser resume events and require the chart to recover without manual reload
These checks do not predict market direction. They only verify that the public data view is functioning as a technical visualization.
Practical Reading Rule
Read a live chart as a technical snapshot of currently available public data. Treat gaps, stale values, reconnects, rate limits and source outages as part of the system. If a downstream choice matters outside the page, verify the underlying data independently and consider the possibility that the visible state is incomplete.
Implementation Notes
app/c/analyzerController.js: public route handling for crawlable pages, robots, sitemap and machine-readable summaries.app/v/public/seoPage.js: conservative SEO metadata, sitemap generation, JSON-LD and/llms.txt.app/tools/productionSiteSmoke.js: production browser smoke checks for live chart health and recovery.
Legal And Disclosure Notes
cryptonabs.com is a read-only public market-data visualization. It is informational only and does not provide financial advice, individualized guidance, custody or trade execution. Market data can be delayed, incomplete or stale. See the risk notice.
This article was prepared with AI assistance and reviewed against the public product boundary before publication.